Beyond the Headlines: The Real Story in USDA’s Ag Trade Numbers.

USDA's latest Outlook for U.S. Agricultural Trade (August 2026) arrived with an enthusiastic message: the world wants more American agriculture. According to USDA Foreign Agricultural Service (FAS) accompanying social-media post, fiscal year (FY) 2027 is projected to be the "second greatest year ever" for U.S. agricultural exports, with exports rising $7.0 billion from the current FY2026 forecast to $186.5 billion. FAS also highlighted a dramatic reduction in the agricultural trade deficit and attributed the improvement to President's trade negotiations, USDA market-development efforts, and stronger sales of U.S. agricultural products abroad.
Those numbers are in the report. But that is not quite the story the numbers tell.

The August 2026 Outlook for U.S. Agricultural Trade is only 11 pages long and contains almost none of the commodity-by-commodity analytical narrative that historically made USDA's quarterly trade outlook useful to agricultural economists, traders, producers, and other market participants. Instead, readers are largely left with tables. Fortunately, those tables contain enough information to reconstruct at least part of the missing story. And when export and import values are examined alongside volumes, the picture becomes considerably more complicated than "the world wants more American agriculture."
First, What Actually "Slashed" the Agricultural Trade Deficit?
Let's start with USDA's headline accomplishment. The agricultural trade deficit reached $42.9 billion in FY2025. USDA currently forecasts it at $25.0 billion in FY2026 and $24.5 billion in FY2027. That is unquestionably a substantial improvement from FY2025.
But look at how it happened.
FY2025 | FY2026 forecast | Change | |
U.S. agricultural exports | $176.3B | $179.5B | +$3.2B |
U.S. agricultural imports | $219.2B | $204.5B | -$14.7B |
Trade balance | -$42.9B | -$25.0B | +$17.9B |
Exports increased by only about 1.8 percent. Imports, meanwhile, declined by approximately 6.7 percent. That distinction matters. The decline in imports also came during a period of persistent tariff turbulence, when higher trade costs made many imported products more expensive and encouraged consumers and businesses to reduce purchases, substitute toward other products, or source goods elsewhere. In other words, part of the shrinking import bill may reflect weaker demand for increasingly expensive imported goods, not an improvement in U.S. export competitiveness. The dramatic improvement in the agricultural trade balance between FY2025 and FY2026 was therefore driven overwhelmingly by lower import value, not by an extraordinary expansion in U.S. agricultural exports. That is a very different economic story from simply saying that stronger foreign demand for American agriculture "slashed" the deficit.
And USDA's FY2027 forecast makes the distinction even clearer. Exports are projected to increase another $7.0 billion, from $179.5 billion to $186.5 billion. But imports are simultaneously projected to rebound $6.5 billion, from $204.5 billion to $211.0 billion. The result? Despite that celebrated $7 billion increase in exports, the agricultural trade deficit improves by just $0.5 billion, from $25.0 billion to $24.5 billion. Trade balances have two sides. That may sound elementary, but it becomes rather important when one side is doing most of the work behind a headline.
Table 3: Are We Actually Exporting More or Are the Exports Worth More?
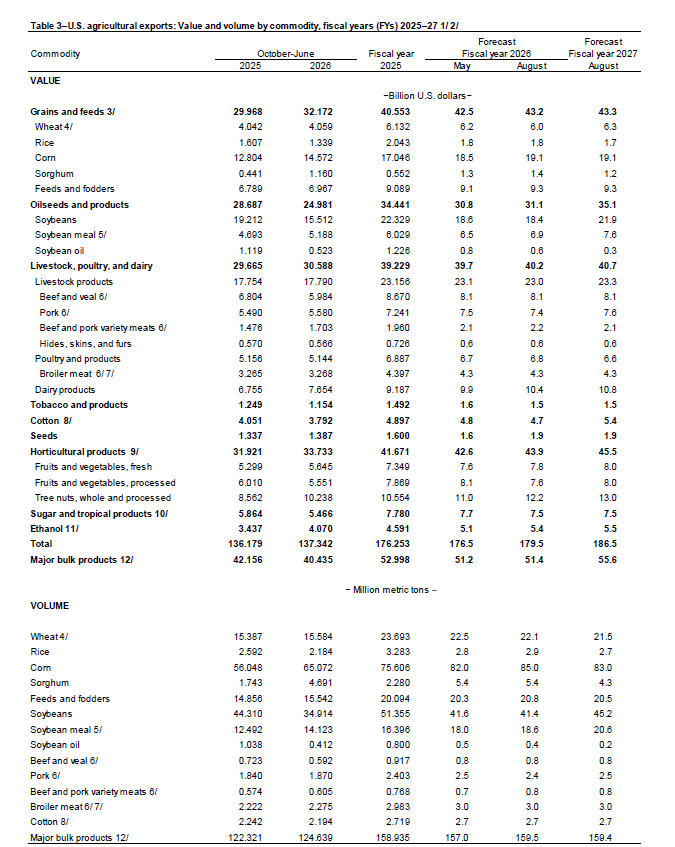
Source: USDA August 2026 Outlook for U.S. Agricultural Trade
This is where USDA's report becomes much more interesting. Table 3 provides both the value and volume of major U.S. agricultural exports. Looking at the two together allows us to distinguish, at least approximately, between growth generated by greater physical shipments and growth generated by prices and changes in commodity composition.
Consider USDA's "major bulk products" category, which includes wheat, rice, coarse grains, soybeans, and cotton. USDA forecasts:
Major bulk exports | FY2026 | FY2027 | Change |
Value | $51.4B | $55.6B | +8.2% |
Volume | 159.5 MMT | 159.4 MMT | ~0% |
This is perhaps one of the most important numbers in the entire report. The value of major bulk agricultural exports is projected to rise more than 8 percent while physical export volume is essentially unchanged. That does not mean the export forecast is bad news. Higher prices can obviously increase farm revenues and export earnings. But it does mean that rising export dollars should not automatically be interpreted as the world buying dramatically larger quantities of U.S. agricultural commodities. The commodity details make that distinction even clearer.
Corn: Lower Volume, Same Export Value
USDA forecasts FY2026 corn exports at: 85.0 MMT worth $19.1 billion.
For FY2027: 83.0 MMT worth $19.1 billion.
Physical corn exports therefore decline by approximately 2.4 percent, while export value remains unchanged. If "the world wants more American agriculture" is interpreted as greater physical demand, corn certainly does not support that characterization in FY2027.
Wheat: Less Wheat, More Dollars
Wheat tells an even cleaner price-versus-volume story.
USDA forecasts wheat exports falling from: 22.1 MMT in FY2026 → 21.5 MMT in FY2027.
Yet export value increases from: $6.0 billion → $6.3 billion.
That is roughly a 2.7-percent decline in volume accompanied by a 5-percent increase in value. Again, higher export value is economically important. But it is not synonymous with stronger export volume.
Soybeans: Here We Actually Have Volume Growth—If USDA Is Right
Soybeans tell a different story, although Demetrica does not agree with USDA's current soybean export projection. For the moment, however, let's stay within USDA's forecast and decipher how the agency sees the market.
USDA forecasts soybean exports increasing from 41.4 MMT in FY2026 to 45.2 MMT in FY2027, while export value jumps from $18.4 billion to $21.9 billion. That represents approximately 9 percent growth in volume and 19 percent growth in value. Here, unlike wheat and corn, USDA is forecasting significantly more physical product moving into foreign markets. But there is an important caveat. Soybeans alone account for $3.5 billion of USDA's projected $7.0 billion increase in total agricultural exports between FY2026 and FY2027. In other words, one commodity accounts for half of the entire projected increase in U.S. agricultural export value.
Soybeans have historically carried substantial weight in the U.S. agricultural export portfolio. That also means an overly optimistic soybean forecast can materially inflate the headline agricultural export number. If the additional soybean volume USDA currently anticipates does not materialize, the $186.5 billion total agricultural export forecast could look considerably different.
Demetrica has discussed the reasons for questioning USDA's soybean outlook separately, but for purposes of this article, the important point is simple: the projected surge in soybean exports is doing a remarkable amount of work underneath USDA's headline FY2027 agricultural export forecast. That is another reason commodity-level analysis matters. A near-record aggregate export value can look considerably less certain once we examine the assumptions carrying it.
Soybean Meal: Growth Story
Soybean meal may be one of the more consequential lines in Table 3.
USDA forecasts U.S. soybean meal exports increasing from: 18.6 MMT in FY2026 → 20.6 MMT in FY2027, while export value rises: $6.9 billion → $7.6 billion.
That is nearly 11 percent growth in physical export volume. Unlike some of the aggregate export-value headlines, this represents a genuine expansion in the quantity of U.S. agricultural product expected to move into the world market.
And it deserves analysis: Where will those additional 2 MMT go? What is driving foreign meal demand? How much additional U.S. crush capacity is coming online? How competitive will U.S. meal be against South American supplies? Those are exactly the questions a quarterly agricultural trade outlook should help answer. Instead, the reader gets the number.
At Demetrica, we have taken that analysis further. Our newly released 2026/27 U.S. soybean meal outlook examines the export opportunity market by market, including projected U.S. soybean meal exports by destination and the competitive dynamics that will determine where additional U.S. supplies can realistically go. The full report is available here: https://www.demetricaanalytics.com/product-page/more-us-soybean-meal-is-coming-mapping-global-demand-for-202627
Soybean Oil Goes the Other Direction
There is also a striking counterexample sitting immediately below soybean meal. USDA forecasts soybean oil exports falling from 0.4 MMT in FY2026 to just 0.2 MMT in FY2027, while export value simultaneously falls from $0.6 billion to $0.3 billion. That represents a 50-percent reduction in projected export volume.
The contrast with soybean meal is particularly noteworthy. USDA is forecasting more soybean crushing and substantially larger soybean meal exports, yet even less soybean oil is expected to move into international markets. The two products come from the same soybean, but increasingly face very different demand structures. Expansion of the U.S. biofuel program is creating stronger domestic demand for soybean oil and other renewable fuel feedstocks, keeping more soybean oil at home. At the same time, elevated domestic soybean oil prices make U.S. supplies less competitive in the global export market, further reducing the incentive to ship oil abroad.
The result is an increasingly important feature of the U.S. soybean complex: additional crushing creates more soybean meal that needs to find a home in export markets, while a growing share of the accompanying soybean oil can be absorbed domestically by the biofuel sector. More U.S. soybean crush, therefore, does not automatically mean more exports of every soybean product.
Table 5: The Import Side Tells an Important Story

Source: USDA August 2026 Outlook for U.S. Agricultural Trade
If Table 3 complicates the export narrative, Table 5 does the same for imports. USDA forecasts total agricultural imports rebounding from $204.5 billion in FY2026 to $211.0 billion in FY2027. But individual commodities behave very differently.
Beef: More Dollars, But Not Necessarily More Beef
USDA forecasts U.S. beef and veal imports at: FY2026: $16.7 billion and 2.0 MMT. FY2027: $17.5 billion and 2.0 MMT. Import value therefore rises almost 5 percent, while reported volume - at least at the precision provided in the table - is unchanged. That immediately raises a question the report no longer attempts to answer: Is the increase primarily a price story?
Given the rounding of USDA's volume forecast to one decimal place, we cannot calculate the precise implied unit-value change from this table alone. But we can certainly see that a higher import bill does not necessarily mean a comparable increase in the quantity of imported beef. That distinction is particularly important given the current political attention surrounding U.S. beef imports.
Vegetable Oils: This One Really Is a Volume Story
Vegetable oils look very different. USDA forecasts:
Volume: 9.0 MMT → 10.8 MMT
Value: $14.6B → $17.9B
That is approximately a 20-percent increase in physical volume and a roughly 23-percent increase in value. This is not simply higher prices making an import category look larger. USDA is forecasting substantially more vegetable oil entering the United States.
There are several important markets sitting underneath that aggregate number. The United States imports substantial quantities of canola oil from Canada, which serves both food markets and the expanding renewable fuels sector. At the same time, palm oil imports have become increasingly important in food manufacturing, including applications where manufacturers use palm oil as an alternative to other vegetable oils.
And not every increase in the vegetable oil import bill is necessarily a biofuel story. The United States is also a major importer of olive oil, where supply conditions and prices follow a very different set of fundamentals. Repeated drought and extreme heat across important Mediterranean producing regions have periodically constrained olive production and contributed to elevated olive oil prices in recent years.
In other words, the projected increase in U.S. vegetable oil imports potentially reflects several forces operating simultaneously: expanding renewable fuel feedstock demand, changing food-use patterns, substitution among competing oils, and global production and price conditions. Considering the enormous structural changes occurring in U.S. renewable fuels and feedstock demand, a projected 1.8-MMT increase in vegetable oil imports in a single year is a major agricultural trade story hiding in plain sight inside Table 5. Yet the report provides essentially no narrative explaining which oils are expected to supply that growth, where they will come from, or what is driving the additional demand.
"Second Greatest Year Ever" Needs Context
USDA's statement that FY2027 is projected to be the second-highest year ever for U.S. agricultural exports is consistent with the nominal-dollar series presented in Table 1.

USDA forecasts $186.5 billion in exports for FY2027, below the $196.0 billion recorded in FY2022. But these are nominal dollars. That distinction should be obvious in an economic report. Commodity prices change. Inflation changes. Exchange rates change. Production shortfalls change prices. Wars disrupt markets. Droughts change global supplies. Tariffs redirect trade. Freight costs move. Commodity composition changes. A dollar of agricultural exports is not a bushel, metric ton, pound of beef, or bale of cotton. And USDA's own FY2027 forecast demonstrates why that matters.
Major bulk agricultural export volume is essentially flat: 159.5 MMT → 159.4 MMT.
Major bulk export value nevertheless rises: $51.4 billion → $55.6 billion.
Calling that an export record may be statistically correct in nominal-dollar terms.
Interpreting it as evidence that foreign buyers suddenly want dramatically larger quantities of American agricultural products is something else entirely.
What Is Missing From USDA's Agricultural Trade Outlook?
Perhaps the biggest issue is not any individual forecast. It is what has disappeared from the report. Historically, the Outlook for U.S. Agricultural Trade provided analytical narrative around the numbers. That narrative helped readers understand why forecasts changed and what was happening underneath aggregate trade values. The August 2026 edition is just 11 pages. It provides useful tables covering total trade, macroeconomic assumptions, commodities, regions, and forecast reliability. But there is virtually no commodity-market narrative explaining what is driving the forecasts. And that leaves some rather important questions unanswered.
Why is USDA forecasting higher wheat export value despite lower volume?
Why does corn volume decline while export value remains unchanged?
What markets are expected to absorb another 2 MMT of U.S. soybean meal?
Why are soybean oil exports projected to be cut in half?
Why are U.S. vegetable oil imports projected to surge 20 percent by volume?
What explains the divergence between beef import value and reported import volume?
And how much of the projected increase in total agricultural export value represents additional physical demand for U.S. products versus higher expected prices?
The numbers required to begin answering those questions are sitting inside USDA's own tables. The analysis connecting them is largely gone.
The Tables Still Tell a Story - If You Read Them
There is good news in USDA's August forecast. U.S. agricultural exports are projected to increase, and in some commodities that growth reflects genuinely larger volumes moving into world markets. USDA expects higher soybean and soybean meal exports, for example, while total agricultural export value is projected to reach $186.5 billion in FY2027.
But that is only one part of the story.
Across the major bulk commodities, USDA projects export value rising by more than 8 percent while combined physical volume remains essentially unchanged. Corn export volume declines. Wheat volume declines even as its export value increases. Soybeans account for half of the projected $7 billion increase in total U.S. agricultural export value, making the headline forecast unusually dependent on USDA's soybean assumptions.
The soybean complex itself tells an even more interesting story. USDA expects additional crushing to generate more soybean meal that must find buyers abroad, while soybean oil exports are projected to fall by half as a growing U.S. biofuel market keeps more oil at home and high domestic prices limit its competitiveness overseas.
Then there is the import side. USDA projects vegetable oil imports jumping by 1.8 MMT in a single year, potentially reflecting the intersection of renewable fuel feedstock demand, food-use substitution, and very different global markets for canola, palm, olive, and other oils. Meanwhile, the dramatic improvement in the agricultural trade deficit in FY2026 came not from an extraordinary surge in exports, but overwhelmingly from a sharp decline in the value of imports.
These are very different economic stories hiding inside the same headline numbers. A rising export value can mean more product was sold. It can also mean roughly the same amount of product became more expensive. It can even mean less product was exported at a higher price. Likewise, a shrinking trade deficit can result from stronger exports—or, as FY2026 demonstrates, largely from declining imports. Those distinctions are not technical footnotes. They are the economic story.
USDA's latest social-media post provides a very simple one: “The world wants more American agriculture.” USDA's own tables provide a considerably more interesting answer:
Sometimes it does. Sometimes the world is paying more for less. Sometimes one commodity is carrying an outsized share of the forecast. Sometimes growing domestic demand is pulling a commodity away from exports. Sometimes the United States itself needs substantially more product from abroad. And sometimes a celebrated improvement in the trade balance has more to do with what Americans stopped importing than with what the rest of the world started buying.
USDA's headline numbers may not be wrong, but they are incomplete without the economic context that used to be an important part of agricultural trade analysis.
That is why agricultural trade analysis requires more than reading the political headline.
Sometimes you just have to read the table.


Comments