U.S. Beef Imports Are Up 12% in 2026, But the Data Come with a Catch

U.S. beef imports continued to climb during the first half of 2026. Based on Demetrica's analysis of USDA Global Agricultural Trade System (GATS) data, converted to carcass-weight equivalent (CWE), U.S. beef imports reached approximately 1.5 million metric tons during January–June 2026, compared with 1.3 million metric tons during the same period of 2025. That is an increase of approximately 12% year over year. The increase comes after several years of rapid growth in U.S. beef imports. GATS-derived series increased from approximately 1.5 MMT CWE in 2021 to 2.4 MMT in 2025. USDA currently forecasts another increase in beef imports for the calendar year 2026 at 2.6 million tons.
At the aggregate level, the direction is straightforward: the United States is importing more beef. Figuring out exactly what kind of beef is behind the 2026 numbers, however, is considerably more complicated.
CHART: U.S. Beef Imports by Major HS Categories
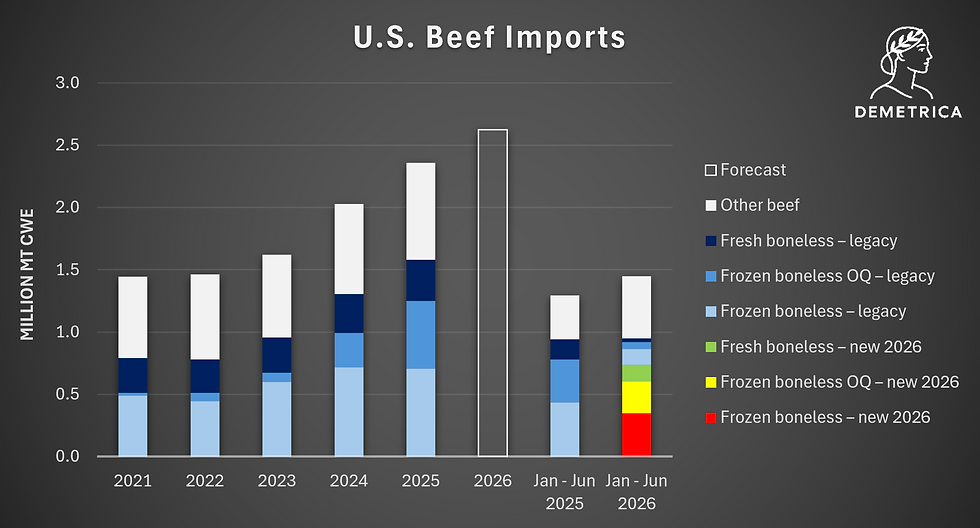
Note: 2021–2025 represent full-year GATS trade data converted to CWE. January–June columns represent GATS trade for the respective periods. The 2026 full-year forecast is USDA PSD and is shown separately from the GATS-derived historical series. Several U.S. beef HTS statistical classifications changed in 2026, shifting substantial trade from legacy codes into newly created categories. Source: USDA GATS, USDA PSD; Demetrica calculations.
A Statistical Curveball in an Important Year for Beef
Several of the largest 10-digit HTS statistical categories used to report U.S. beef imports changed in 2026. New statistical breakouts were introduced, including separate classifications for certified organic and other beef. This creates a major problem for anyone attempting a straightforward year-over-year comparison. Look only at the historical HS codes, and the data suggest that several major categories of U.S. beef imports collapsed during 2026. Frozen boneless beef under 0202305085, for example, falls from approximately 436,000 MT CWE in January–June 2025 to 125,000 MT in January–June 2026, an apparent decline of 71%. Frozen boneless over-quota beef under 0202308000 appears to plunge 83%, from approximately 344,000 MT to 57,000 MT CWE. Fresh/chilled boneless beef under 0201305085 appears to fall 81%, from approximately 164,000 MT to just 30,000 MT CWE. Yet total U.S. beef imports increased 12%.
The explanation becomes apparent further down the GATS table. Several codes with no reported imports prior to 2026 suddenly become some of the largest categories in the entire beef import dataset. New 0202305097 reports approximately 349,000 MT CWE during January–June 2026. New 0202308025 accounts for another 255,000 MT, while 0201305097 contributes approximately 134,000 MT. Together, those three newly appearing codes account for approximately 738,000 MT CWE during the first six months of 2026. Obviously, the United States did not suddenly discover three entirely new beef import markets totaling nearly three-quarters of a million tons. Much of the trade simply moved into new statistical classifications. That makes 2026 a particularly inconvenient year for simple HS-code comparisons, especially given the attention U.S. beef imports are receiving amid tight domestic cattle supplies, high beef prices, and renewed debate over tariffs, quotas, and expanded foreign beef access.
Putting the HS Codes Back Together
Fortunately, supplier-country data help reconstruct comparable trade flows. For analytical purposes, the major changes can broadly be thought of this way:
Comparable product group | 2025 classification | Relevant 2026 classifications |
Fresh/chilled boneless | 0201305085 | 0201305085 + 0201305091 + 0201305097 |
Frozen boneless | 0202305085 | 0202305085 + 0202305091 + 0202305097 |
Frozen boneless, over quota | 0202308000 | 0202308000 + 0202308015 + 0202308025 |
The new codes distinguish statistical categories that previously were not separately reported, including organic versus other beef. Recombining them does not solve every comparability issue, but it produces a much more meaningful picture than comparing individual 10-digit codes. And once we do that, some of those spectacular declines disappear.
Frozen Boneless Beef: Australia and New Zealand Remain Major Suppliers
Consider frozen boneless beef. During January–June 2025, legacy code 0202305085 accounted for approximately 321,000 MT product weight, led by Australia, New Zealand and Brazil. Australia supplied approximately 141,000 MT, New Zealand 104,000 MT and Brazil 49,000 MT. Argentina and Uruguay were considerably smaller suppliers. In 2026, the old code falls dramatically, but new code 0202305097 suddenly reports approximately 257,000 MT product weight. Its leading suppliers are:
Australia: 119,000 MT
New Zealand: 96,000 MT
Argentina: 27,000 MT
Canada: 4,800 MT
Uruguay: 3,700 MT
Mexico: 3,100 MT
The continuity becomes clearer when the old and new codes are combined. Australia supplied approximately 141,000 MT under the comparable legacy category during H1 2025. In H1 2026, approximately 29,000 MT remained under the old code while another 119,000 MT appeared under the new code, a combined 148,000 MT.
New Zealand similarly moves from approximately 104,000 MT in H1 2025 to about 112,000 MT across the old and new classifications in H1 2026. Rather than collapsing, these major frozen beef flows remained substantial and increased modestly.
Argentina appears to have expanded considerably, although the new 2026 tariff treatment and classifications need to be considered when making a direct historical comparison. Brazil, however, tells a different story.
Brazil's Beef Shows Up Somewhere Else
Brazil supplied approximately 49,000 MT under legacy frozen boneless code 0202305085 during January–June 2025. During the same period of 2026, approximately 25,000 MT remained under that code, while Brazil contributed only about 550 MT to new 0202305097. So where did Brazil's beef go?
Much of the answer lies in the over-quota frozen boneless category. In January–June 2025, legacy over-quota code 0202308000 accounted for approximately 253,000 MT product weight. Brazil alone supplied approximately 150,000 MT, followed by Uruguay at 56,000 MT, Paraguay at 19,000 MT, Nicaragua at 12,000 MT, and Argentina at 11,000 MT. The legacy code appears to collapse in 2026, but the newly created 0202308025 reports approximately 188,000 MT product weight, and its supplier composition looks remarkably familiar. Brazil supplied approximately 138,000 MT, accounting for nearly three-quarters of the new category. Paraguay supplied approximately 17,500 MT, Uruguay 16,300 MT, and Nicaragua 10,500 MT.
When the relevant old and new over-quota codes are reconstructed, total frozen boneless over-quota imports were approximately: 253,000 MT product weight in January–June 2025 versus approximately 256,000 MT in January–June 2026. In other words, the category that appears to have declined 83% when looking only at the legacy HS code was actually roughly unchanged after accounting for the new statistical classifications.
That is quite a different market story. It also highlights an important characteristic of Brazilian beef shipments to the United States: Brazil is heavily represented in frozen boneless beef, and particularly in the over-quota trade.
Fresh Boneless Beef: Same Trade, Different Codes
Fresh/chilled boneless beef provides perhaps the cleanest demonstration of the statistical issue. During January–June 2025, legacy code 0201305085 accounted for approximately 120,000 MT product weight. Canada supplied approximately 41,000 MT, Australia 39,000 MT, and Mexico 31,000 MT. Together, those three countries accounted for the overwhelming majority of the category. Look only at the old code in 2026, and imports collapse to just 22,000 MT. But new 0201305097 contributes another 99,000 MT, again dominated by the same countries:
Australia: 34,000 MT
Canada: 32,000 MT
Mexico: 25,000 MT
Argentina: 3,000 MT
Uruguay: 2,100 MT
New Zealand: 1,700 MT
Once the relevant classifications are combined, January–June 2026 imports reach approximately 123,000 MT product weight, compared with approximately 120,000 MT during January–June 2025. So, an apparent 81% decline becomes roughly a 2% increase. The country comparisons tell essentially the same story. Australia moves from approximately 39,000 MT to 41,000 MT across the comparable categories. Canada moves from about 41,000 MT to 38,000 MT, while Mexico remains around 31,000 MT.
The physical trade changed relatively little. The statistical codes have changed a lot.
Some Import Growth Is Very Real
Not everything unusual in the 2026 data can be explained by reclassification. Fresh/chilled boneless over-quota beef under 0201308090 is one example. Imports increased from approximately 26,000 MT product weight during January–June 2025 to 47,000 MT during January–June 2026—an increase of roughly 82%. Brazil is particularly notable. Brazilian shipments under this category increased from approximately 8,200 MT to 18,300 MT, more than doubling year over year. Nicaragua increased from approximately 9,500 MT to 16,900 MT, while Mexico increased from about 1,000 MT to 3,200 MT. This category has also grown dramatically over a longer period. Total imports were only about 7,400 MT in 2021, increasing to nearly 42,000 MT in 2024 and approximately 86,000 MT in 2025. Unlike the apparent collapses in the legacy codes, this represents a genuine change in the trade.
Canada and Mexico Tell a Different Beef Story
The detailed data also reinforce the point that "beef imports" should not be treated as a single homogeneous commodity. Fresh/chilled boneless chuck under 0201305035, for example, increased approximately 19% year over year during the first half of 2026. Canada supplied approximately 31,000 MT, compared with 30,000 MT during the same period last year. Mexico increased from roughly 4,600 MT to 8,200 MT, while Australia supplied another 4,000 MT. Brazil supplied virtually none.
Fresh/chilled boneless loin imports also increased strongly, rising approximately 31% in CWE terms during the first half of the year. These product-level differences matter. Canada and Mexico are part of a deeply integrated North American cattle and beef supply chain and feature prominently in fresh/chilled beef and individual cuts. Australia and New Zealand remain major suppliers of frozen boneless beef. Brazil and other South American suppliers play an increasingly important role in frozen boneless imports, including substantial over-quota volumes. A discussion focused solely on total beef imports can miss these distinctions.
What the First Half of 2026 Actually Tells Us
The changing HS codes make the details messy; however, they do not change the central finding that U.S. beef imports reached approximately 1.5 MMT CWE during January–June 2026, up 12% from 1.3 MMT during the same period last year. Several apparent collapses in major beef categories are statistical illusions created by new 2026 HTS classifications. Reconstructing the old and new codes shows that some of the largest physical trade flows— including fresh boneless beef and frozen boneless over-quota beef — were much more stable than individual HS-code growth rates suggest. But beneath that statistical noise are also genuine changes.
Brazil remains a major supplier of frozen boneless beef and is particularly prominent in over-quota shipments. Australia and New Zealand continue to supply large volumes of frozen boneless beef. Canada and Mexico remain central to the fresh/chilled trade. And some smaller categories, particularly fresh/chilled over-quota beef, are expanding rapidly. That distinction becomes particularly important in today's debate over U.S. beef supplies.
Saying simply that "the United States is importing more beef" is accurate, but incomplete.
The more important questions are what beef is being imported, where it is coming from, under what tariff and quota treatment it is entering, and how those imports fit into the much larger U.S. cattle and beef supply-and-demand picture. The first six months of 2026 indicate that imports continue to rise.
There is much more to the U.S. beef story than a single import number. Stay tuned, more Demetrica beef analysis is coming soon as we dig deeper into trade flows, tariffs and quotas, domestic supply, and the changing global beef market.


Comments